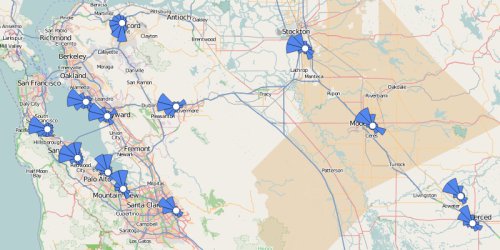
Windhistory.com shows the prevailing winds at various weather reporting stations, mostly airports. It was developed to help pilots better understand typical wind patterns. For example the map view shows how the wind comes off the San Francisco bay and the station view makes it apparent why Santa Fe, NM has three runways.
The map view shows small wind rose diagrams for some 2500 stations in North America. It supports the usual pan and zoom interface. The example image above is for central California showing prevailing winds off the bay and from the northwest in the central valley. Type a four character station ID in the search box to go directly to a station. Note that when zoomed out very far the wind roses are replaced by dots for performance.
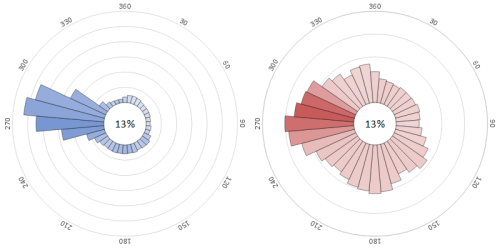
The station view shows the prevailing winds for a single weather station. Above is an example image for KSFO, San Francisco airport.
The blue diagram at left is a classic Wind Rose. The length of each bar is proportional to the frequency the wind comes from each direction and the colour is proportional to the average speed. At KSFO the wind is pretty much always from the west. The most common direction is 280°, 13% of the time with an average speed of 13kts.
The red diagram at right shows the same data as the wind rose but emphasizes wind speed. Bar length is proportional to average speed and colour is proportional to frequency. At KSFO northeast winds are rare, and when they come they tend to be light. The strongest winds come from 270°, 15kts 11% of the time.
You may hover the mouse over a bar to see exact textual data. In both diagrams the percentage in the middle indicates how often the winds are less than 5 knots (13% at KSFO). There are links on the station page for further information: WeatherSpark is a particularly nice complementary site showing historical weather.
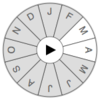 The month filter allows you to display prevailing winds for specific months.
Click the calendar wedges to toggle each specific month off and on.
Click the play button in the middle to animate your selection through
the year.
The month filter allows you to display prevailing winds for specific months.
Click the calendar wedges to toggle each specific month off and on.
Click the play button in the middle to animate your selection through
the year.
The source data for these graphs is the NOAA archive. METARs from 2006 to 2010 were parsed and crunched to calculate average winds for each weather station. Reporting variance and data processing errors mean these diagrams are not true statistical samples.
This site makes extensive use of SVG for graphics. It should work fine in modern versions of Firefox, Safari, Mobile Safari, Chrome, and Microsoft Internet Explorer 9. It will not work in IE 6, 7, or 8 and never will.
This site is a labour of love: feedback and suggestions are most welcome. Please mail comments@windhistory.com with any thoughts you have. Some planned enhancements include showing winds for specific months and showing more detailed histograms.
The data on this site is not suitable for flight planning or other decisions related to weather. All data is historical only and bugs and incomplete data may result in inaccuracies.
The Website is provided "as is". The owner and its suppliers and licensors hereby disclaim all warranties of any kind, express or implied, including, without limitation, the warranties of merchantability, fitness for a particular purpose and non-infringement. Neither the owner nor its suppliers and licensors makes any warranty that the Website will be error free or that access thereto will be continuous or uninterrupted. You understand that you download from, or otherwise obtain content or services through, the Website at your own discretion and risk.
The base map is © OpenStreetMap contributors, CC-BY-SA. Graphics are built client-side with the Polymaps and D3 Javascript libraries; thanks to Mike Bostock for much design and coding advice. Thanks also to the #avgeek crowd on Freenode IRC for feedback and encouragement.
WindHistory.com was built by Nelson Minar as a Daedalus Bits, LLC project.
Wind History. Copyright © 2011 Daedalus Bits, LLC. All rights reserved.